
What is cartridge concentricity? Cartridge concentricity is how straight a cartridge is along it’s center axis. The straighter the round, the lower the concentricity.
Ammunition concentricity is measured using a method called Total Indicator Runout (T.I.R.)- sometimes referred to as Total Indicator Run-out, or Total Indicator Reading- of a cartridge. To measure T.I.R. the cartridge is rolled on a tool, called a concentricity gauge while an indicator is used to measure how many thousandths of an inch the bullet is off center (the distance the needle swings represents the runout). T.I.R. of 0 is perfect. As the T.I.R. value rises, the cartridge is said to be less concentric, or can be described as having runout. Most shooters who check for concentricity will cull ammunition with a runout of more than .003-.004″. For more information about what concentricity is and how it is measured, read Bullet Concentricity and Related Issues at Sinclair, by Bob Kohl.
Concentricity is often cited as a factor in rifle accuracy. According to Frank Green of Bartlein Barrels, this is the reason some shooters believe the best accuracy is found with a barrel twist rate just fast enough to stabilize the bullet. A faster twist rate could exacerbate any problems with an crooked, non concentric bullet entering the chamber. Selecting a twist rate that is just fast enough would help mitigate potential problems from concentricity.
I’ve been trying to get my custom Remington 700 chambered in 7.62x39mm Russian to shoot surplus steel cased ammunition well (I’m well aware this isn’t considered match grade ammunition- but it seems like a worthy project). During testing, I was shooting 5 shot groups with three or four rounds close and a distant flyer. See the group below as an example of what I was experiencing.

I suspected it may have had something to do with concentricity. Spot checking the ammunition with a Sinclair concentricity gauge, I observed fairly significant cartridge runout.

The concentricity gauge, allows the cartridge to roll on its case body, while an indicator measure T.I.R.
I’ve wanted to test the effect of cartridge concentricity on accuracy for a while, however, I was unable to find ammunition with a wide range of runout to test. The low quality of this steel cased ammunition solved this problem.

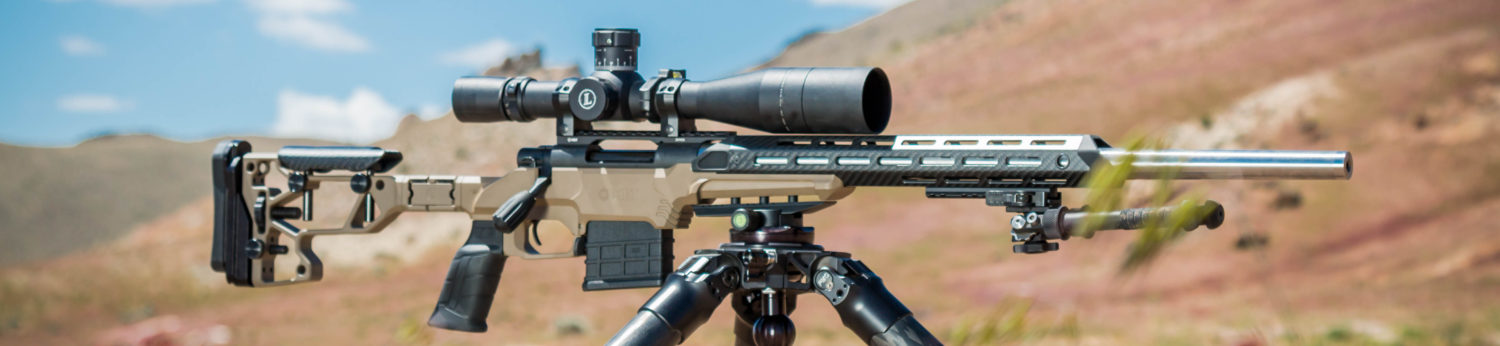
The custom 7.62x39mm Remington 700 test rifle was built with parts from Brownells that includes:
- Remington 700 short action receiver
- Green mountain .310 groove 30 caliber blank turned to sporter contour
- Timney 517 trigger
- MDT HS3 chassis
- MAGPUL PRS stock
- Spuhr mount
- Nightforce NXS 5.5-22×56 mil/mil scope
- Badger FTE brake
- Badger mini tactical knob
I selected 60 rounds of Brown Bear 123 grain JHP from the same lot and measured their concentricity. Each cartridge’s T.I.R. was measured to the nearest .001″ with a Sinclair concentricity gauge and labeled. The results are recorded in the table below.

For the sample of 60 cartridges, T.I.R. was recorded between .002″ and .015″. It averaged .008″, with a standard deviation of .003″.
I sorted the 60 cartridges into 12 different groups based on ascending T.I.R. The average T.I.R. for each group was calculated and rounded to the nearest .001″. Each group of 5 cartridges was fired for accuracy at 100 yards. Shooting was conducted from a bench, with a bipod and rear bag. The NightForce NXS scope, was set at 22 power. Temperature was 37F, there was no detectable wind.
Results are shown in the table below.

Groups sizes were measured center to center with digital calipers. Group sizes ranged from .918″ to 2.725″. Average group size was 1.986″ with a standard deviation of .558″. Note the first two groups, with the lowest average T.I.R. has group sizes larger than the average, 2.096″ and 2.192″ respectively. The smallest group, .918″, was fired with an average T.I.R. of .004. The largest group size, 2.725″ was fired with an average T.I.R. of .009″.
Each group is labeled in the photograph below.

I took the information found in the table above and placed it in a scatterplot, shown below.

In the scatterplot, you’ll notice as the values aren’t steadily rising, however, if you look at the plots, you’ll notice the group size does trend up as T.I.R. increases (or concentricity decreases). I attribute this to the relatively low sample size and lack of controls on the rest of the factors that contribute to accuracy in the ammunition.
To further explore the affect of concentricity on accuracy, I determined the average groups sizes comparing T.I.R. within one standard deviation to the mean against those above and below one standard deviation. This showed the average groups size for a T.I.R. below 1 standard deviation (<.005″) 1.735″, within 1 standard deviation (.005″-.010″) of 2.016″, and over one standard deviation of 2.237″!

This seems to provide support to the theory that ammunition concentricity does in fact affect group size.
It is worth noting that I had expected to see a more clearly defined trend in the individual group scatterplot. This is likely due to the low quality of this mass produced ammunition. While I did select and control for concentricity, I was unable to control for other factors that could effect accuracy, such as variables in the bullets, powder, case and primers.
For further reading on how concentricity effects precision, see “A Key to Improved 22 Long Rifle Accuracy Discovered”, by Lesler L. Nielsen (2004). In this paper, 22 LR ammunition is sorted based on T.I.R. and fired for 10 shot groups at 50 yards from a benchrest rifle. As runout increases, so does group size.
If you are aware of any other studies on this subject, please email me through the contact page so we can link them here.


You must be logged in to post a comment.